


 39 / 84

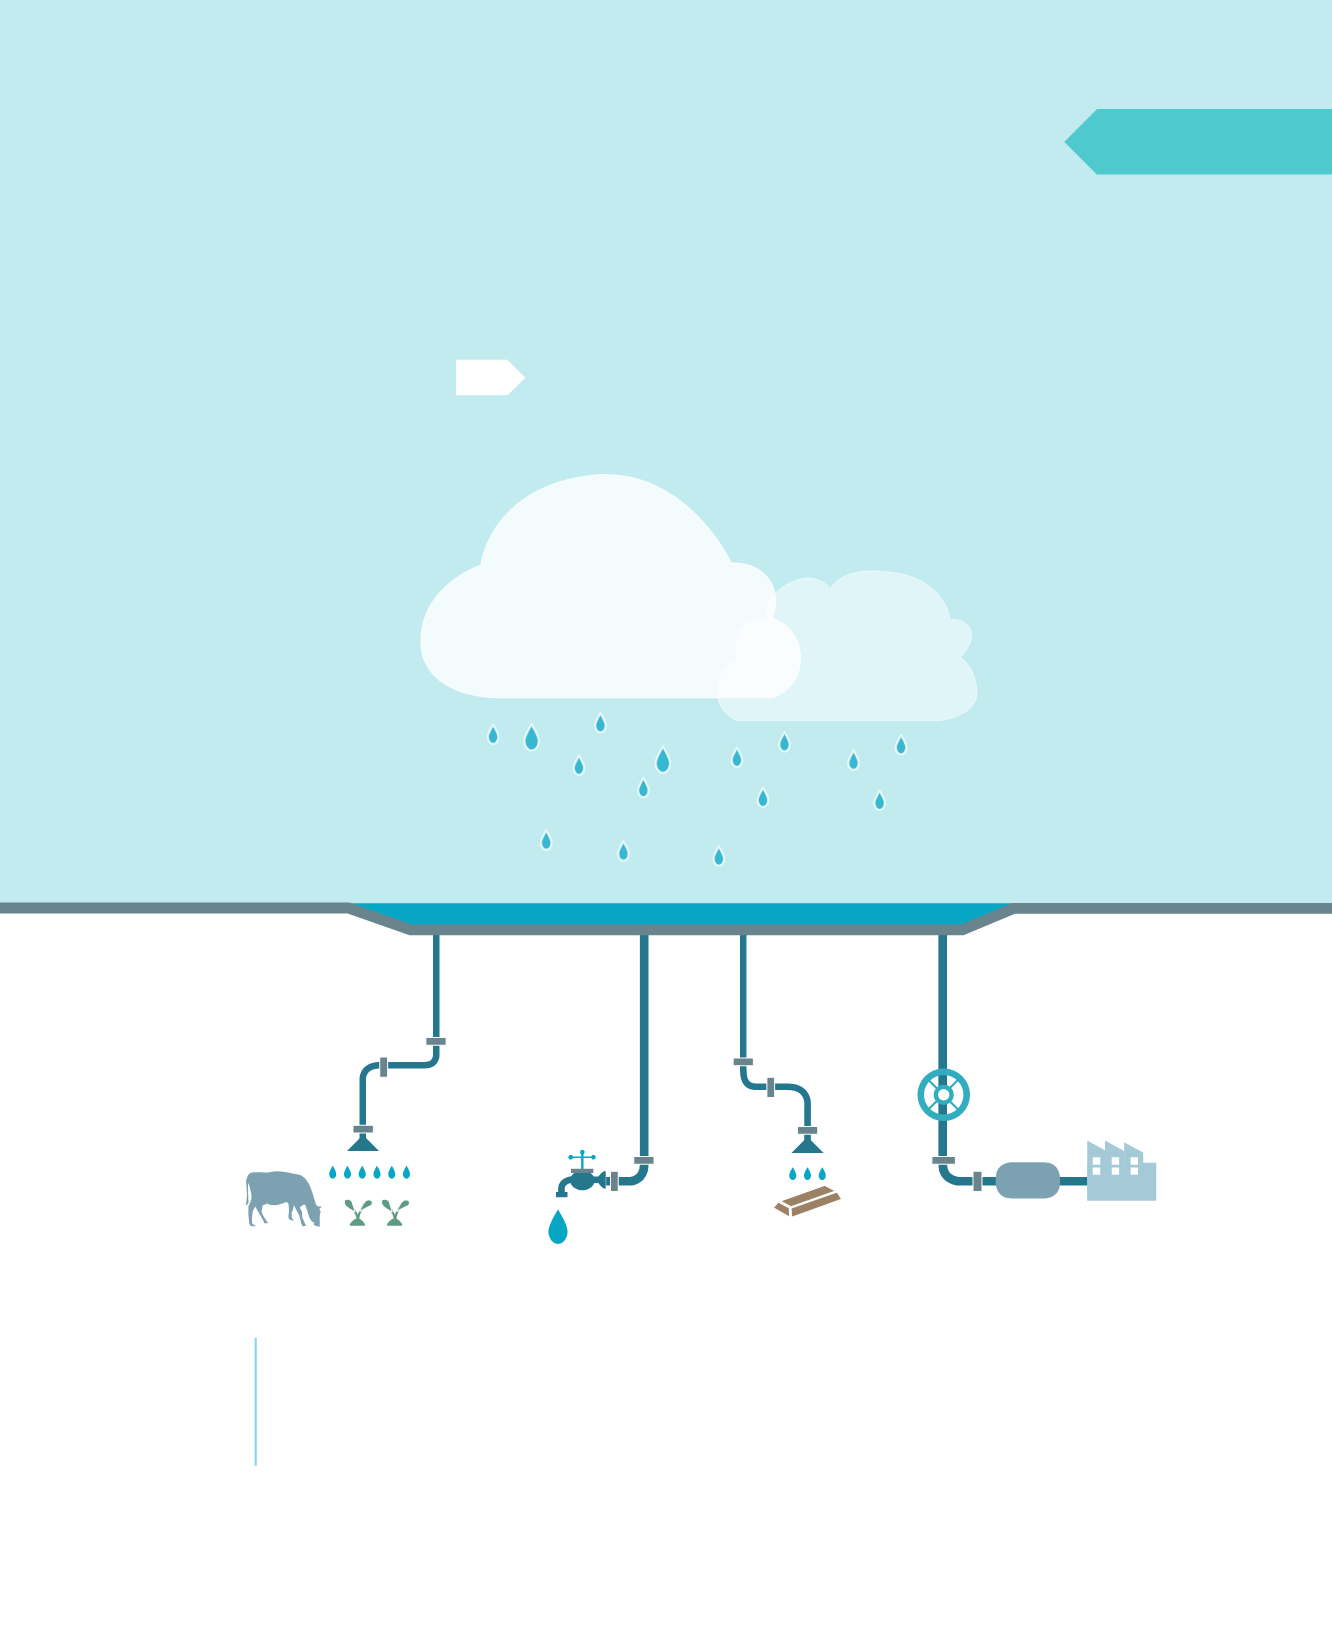
AGROPECUARIO
AGUA POTABLE
MINERO
INDUSTRIAL
MZ NORTE
MZ CENTRO
MZ SUR
MZ AUSTRAL
72%
86%
76%
16%
8%
8%
9%
6%
15%
1%
2%
25%
5%
4%
13%
53%
82%
TOTAL NACIONAL
TOTAL NACIONAL
TOTAL NACIONAL
TOTAL NACIONAL
8% 3% 7%
Recursos hídricos
2
USO ESTIMADO DE AGUA
POR MACROZONA Y POR
SECTOR ECONÓMICO
MACROZONA
Fuente:
Atlas del Agua, Chile 2016.
DGA, Ministerio de Obras Públicas.